![[Univ of Cambridge]](http://www.eng.cam.ac.uk/images/house_style/uniban-s.gif)
![[Dept of Engineering]](http://www.eng.cam.ac.uk/images/house_style/engban-s.gif)
![[DSL]](file:///U:/dsl/dslsmallest.gif)
Large deployable space structures include requirements for reflecting surfaces for antennae, reflectors and solar arrays. Their efficiency depends not only on surface accuracy but also on the vibration characteristics of these reflecting surfaces. Therefore, a more careful study on vibration behaviuor of various prestressed membrane structures is carried out.
A preliminary vibration analysis of arbitrary shape flat membranee is done using a finite element package, ABAQUS, and compared with analytical solutions. The preliminary analysis shows good agreement between finite element, ABAQUS, and analytical solutions. Therefore, in all other simulations ABAQUS is used. As membrane has no compression or bending stiffness, it is prestressed to act as a structural element.
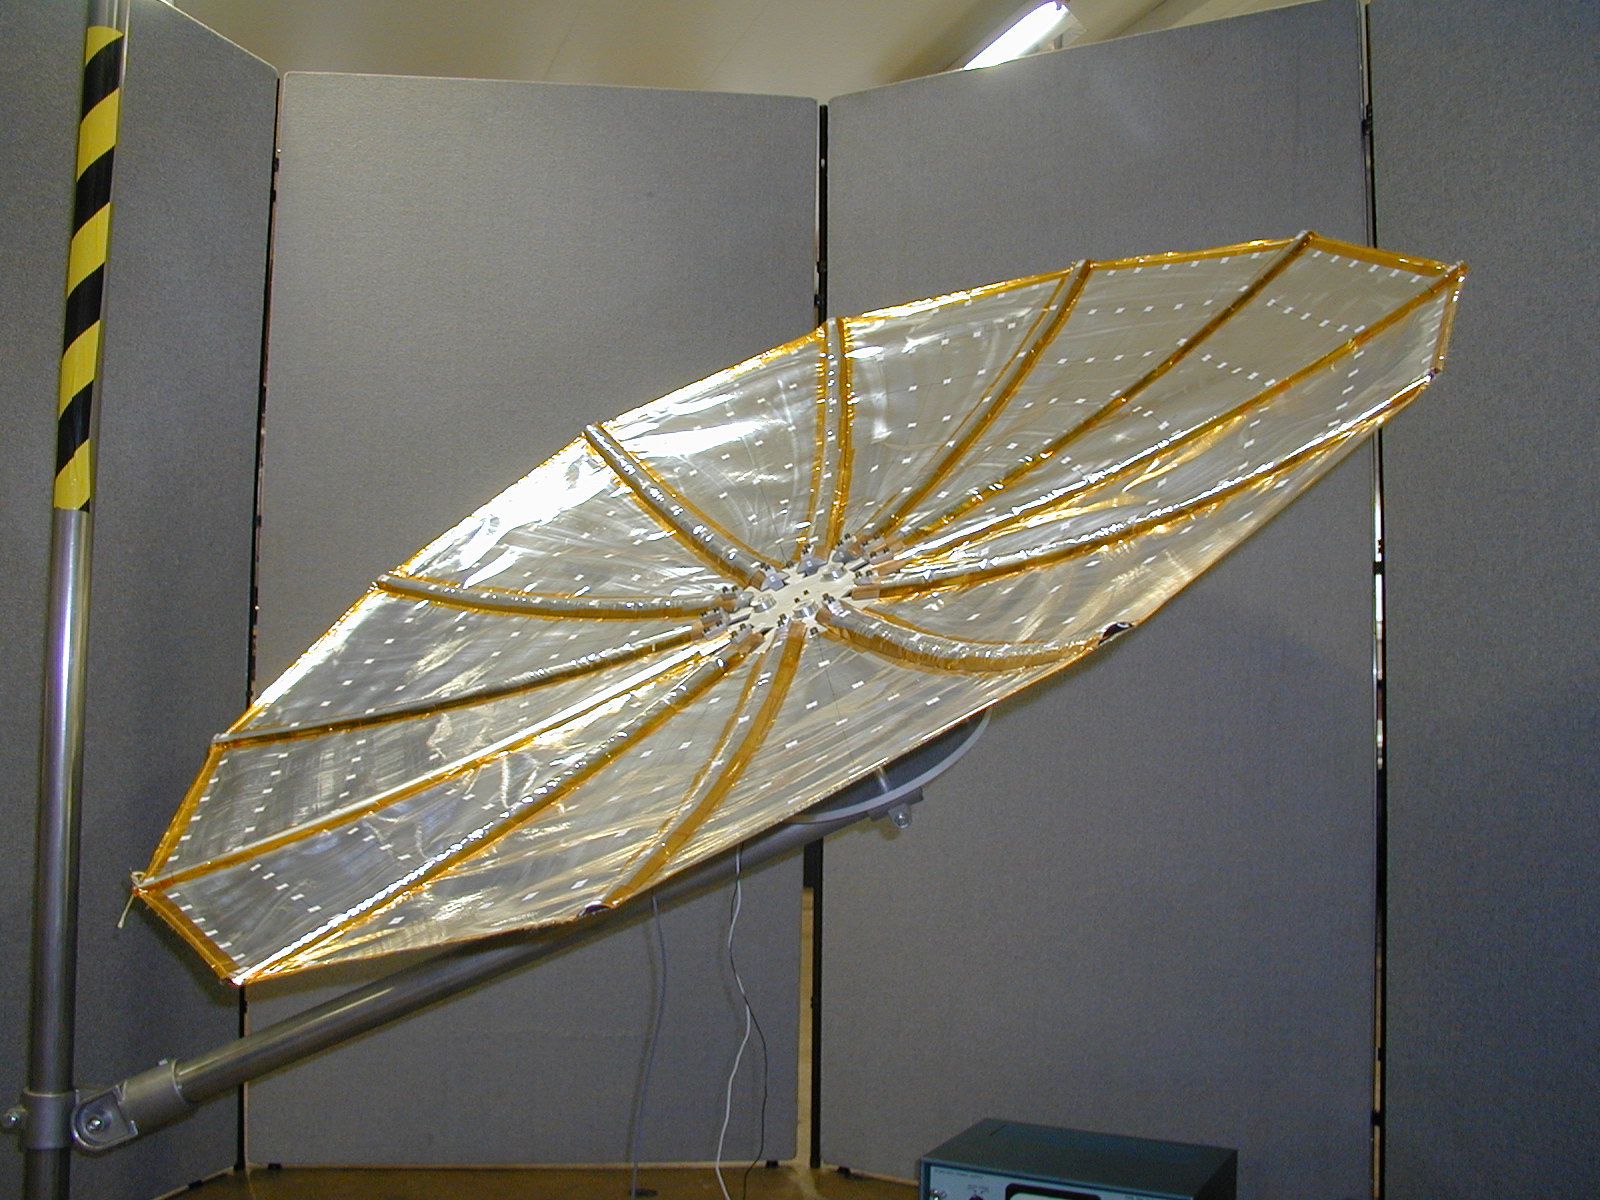
An experimental study of the vibration of a flat membrane is done as shown in Figure 1. The membrane model was excited using a small hammer, and the response is measured using a laser vibrometer to determine the natural frequencies and mode shapes of the model.
The experimental natural frequencies were considerably lower than the finite element results. This indicated the effect of the surrounding air on the membrane vibration. A similar experimental study carried out at various atmospheric pressures in a vacuum chamber, published in 1983, indicates the effect of air on vibration.
A simple analytical method is derived to predict the natural frequencies and mode shapes of flat membranes of any shape vibrating in a fluid at any pressure. The prediction method is validated for a flat membrane.
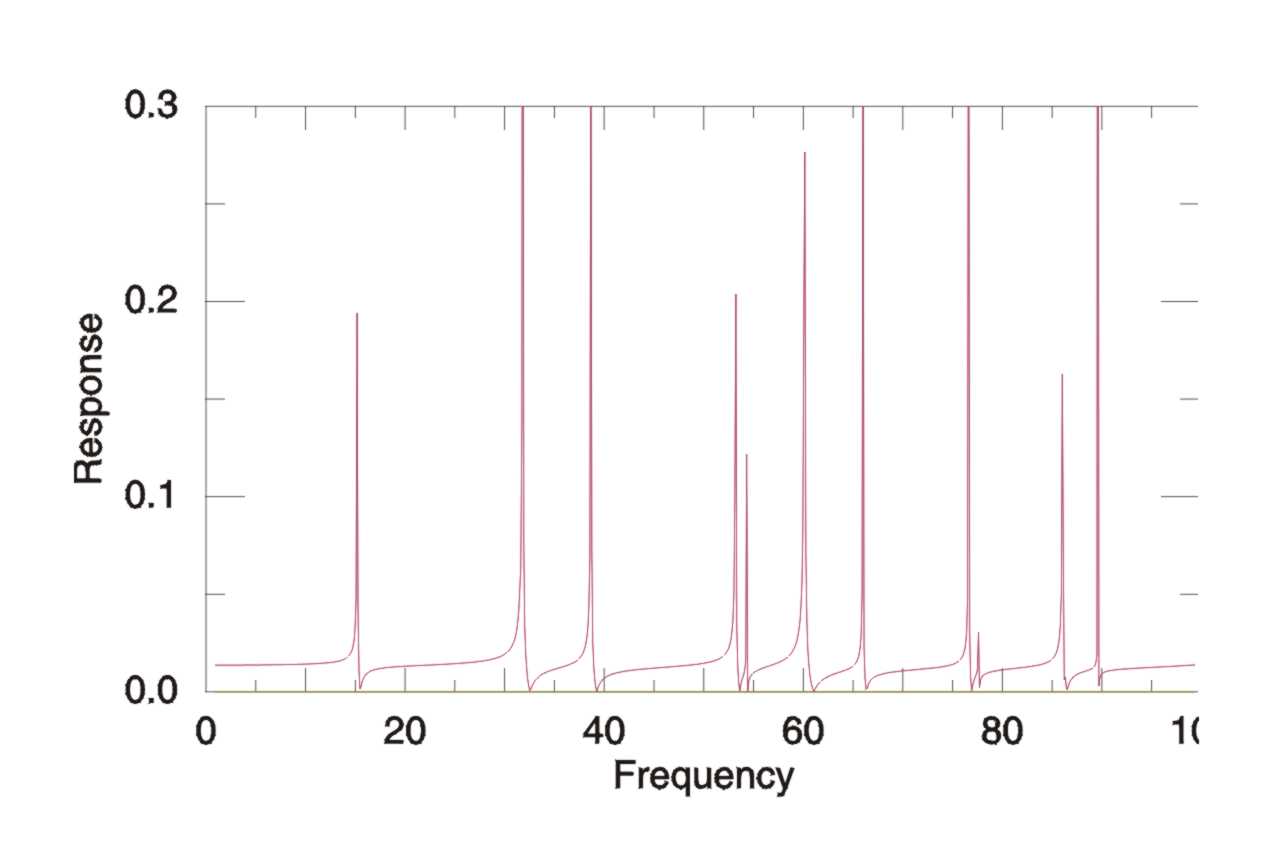
Then, natural frequency and mode shape of a flat membrane vibrating in an unbounded air medium is analysed using finite element techniques, i.e. using ABAQUS. The air medium is characterised by a single pressure variable and the coupling is achieved by considering interface forces between the air medium and the structural surface. The coupling stiffness and mass matrix is unsymmetric. Therefore steady state response analysis carried out to find out resonance frequencies of the model. Natural frequencies are obtained from the response diagram. A sample frequency response plot is shown in Figure 3.
Last updated on February 14, 2001
S. Kukathasan - sk299@eng.cam.ac.uk